Air pollution refers to the presence of harmful substances in the air that can have adverse effects on human health, ecosystems, and the environment. These substances can include gases, liquids, or solid particles, which when introduced into the atmosphere, degrade the quality of air and contribute to numerous environmental and health issues.
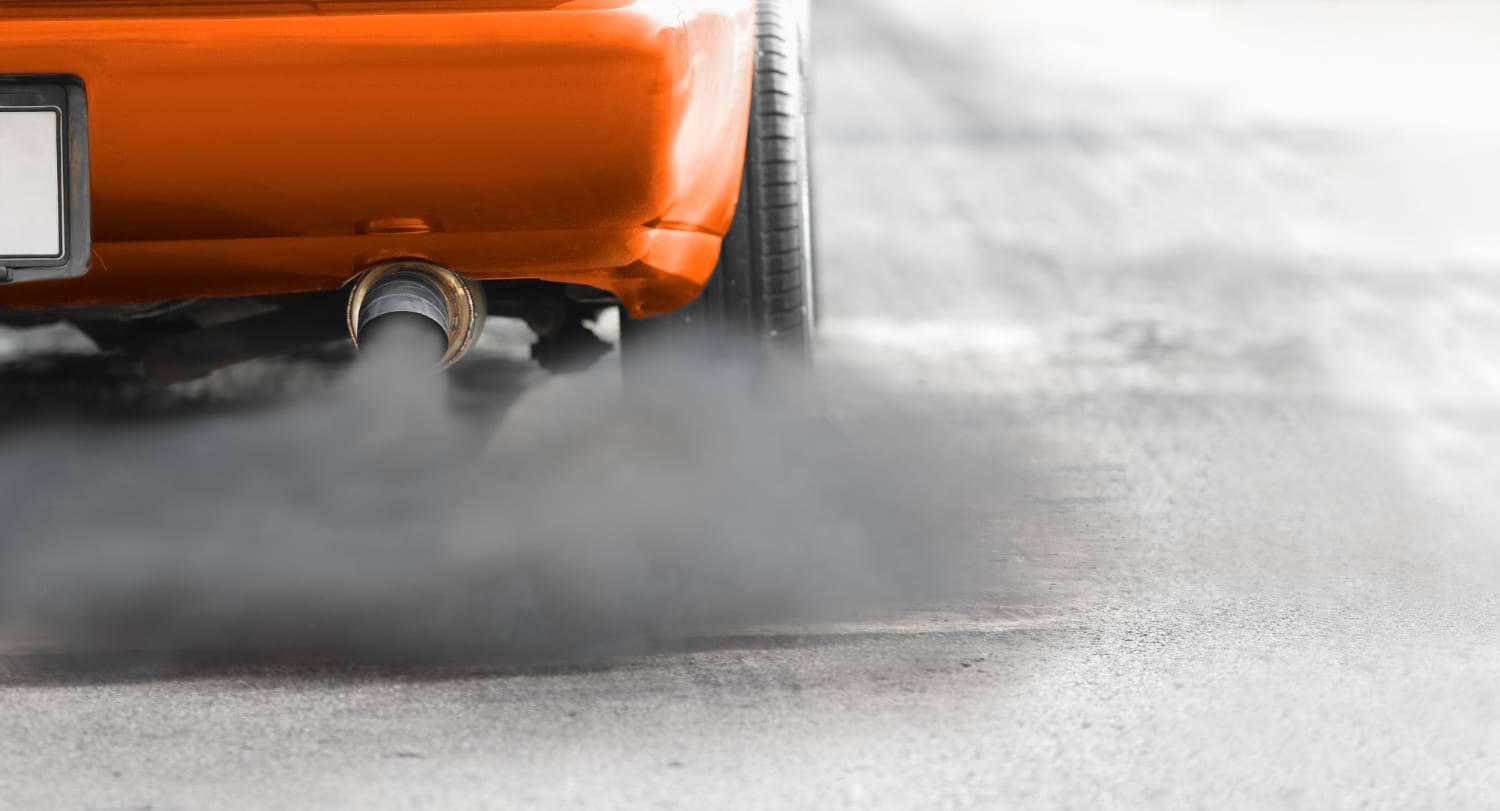
These pollutants often originate from various human activities such as industrial processes, burning fossil fuels, deforestation, and vehicular emissions. Natural sources of air pollution, like volcanic eruptions and wildfires, can also contribute to the problem. When present in excessive amounts, air pollution can lead to the formation of smog, a dense fog that is harmful to both health and visibility. This is where air pollution maps play a critical role in tracking pollution levels and raising awareness about environmental hazards.
Smog: A Dangerous Combination of Pollution
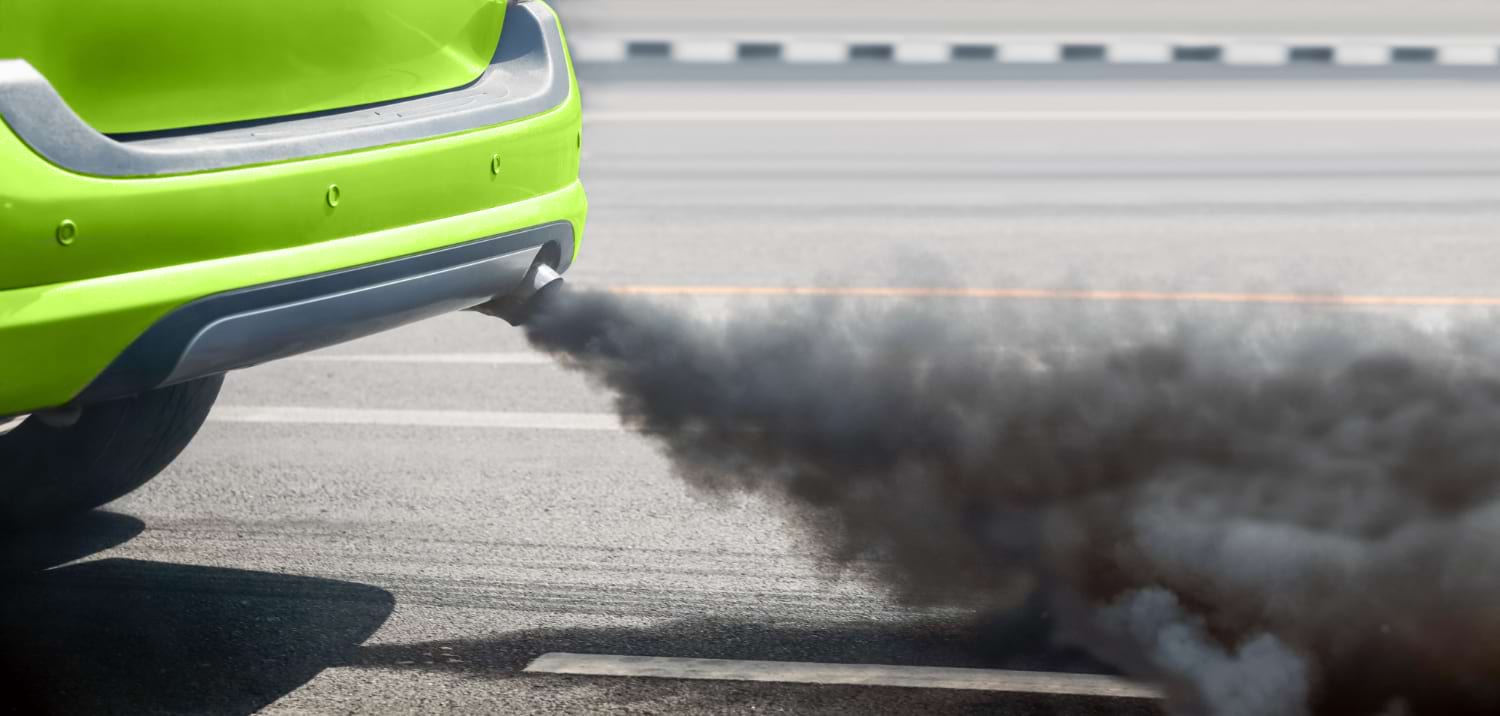
Smog is a form of air pollution that is particularly dangerous due to its high concentration of particulate matter and toxic gases. It is typically a combination of smoke and fog, often resulting from industrial and urban emissions. Smog can be classified into two main types: “classic” or “London-type” smog, and “photochemical” smog, commonly known as “Los Angeles-type” smog.
The classic smog is primarily caused by the burning of coal, which produces large quantities of smoke and sulfur dioxide. In contrast, photochemical smog occurs when pollutants like nitrogen oxides and volatile organic compounds react with sunlight to produce ground-level ozone. Both types of smog pose significant health risks, especially for individuals with respiratory conditions such as asthma, bronchitis, or other chronic obstructive pulmonary diseases (COPD).
Smog Maps Online: A Tool for Monitoring Air Quality
In the digital age, smog maps online have become invaluable tools for tracking air pollution across various regions. These interactive maps display real-time data from monitoring stations and sensors located throughout the world, providing up-to-date information on air quality. Websites and mobile applications like the Air Quality Index (AQI) or specialized tools from environmental organizations allow users to view pollution levels, forecast trends, and take actions to reduce their exposure to harmful air pollutants.
Smog maps typically display a color-coded scale that indicates the air quality in a given area. The scale ranges from “good” (green) to “hazardous” (maroon). The AQI system provides information on concentrations of specific pollutants such as PM2.5, PM10, nitrogen dioxide, sulfur dioxide, and ozone, offering a comprehensive look at air quality in a given location.
Air Pollution and Health: A Growing Concern
The impact of air pollution on human health cannot be overstated. It has been linked to a wide range of health problems, from short-term irritations to chronic diseases and even premature death. The World Health Organization (WHO) reports that air pollution is responsible for millions of deaths every year, making it one of the leading environmental health risks globally. Exposure to polluted air can lead to a variety of respiratory issues, including asthma, bronchitis, and emphysema, as well as cardiovascular diseases such as heart attacks and strokes.
Particulate matter, particularly fine particles like PM2.5, is especially harmful because it can penetrate deep into the lungs and even enter the bloodstream, causing systemic health issues. Additionally, ground-level ozone and nitrogen dioxide can irritate the respiratory system and exacerbate conditions like asthma and COPD. Studies have also shown that long-term exposure to air pollution can increase the risk of lung cancer and even negatively affect cognitive function, leading to conditions like dementia.
The Role of Air Pollution Maps in Future Solutions
As the global community continues to confront the growing challenge of air pollution, air pollution map will remain essential in helping individuals, cities, and nations address this issue. These tools provide critical information for making informed decisions, promoting public health, and enabling more effective environmental policies. The increased availability and accuracy of these maps will empower individuals to take better care of their health and inspire more proactive actions to reduce air pollution at both the personal and governmental levels.
Ultimately, the widespread use of air pollution maps may contribute to a more sustainable future, where the global community works together to reduce pollution levels and safeguard public health for generations to come. By leveraging technology and fostering international cooperation, it is possible to make significant strides in the battle against air pollution, ensuring a cleaner, healthier environment for all.
Author Profile
Latest entries
 TourismMarch 26, 2026911770751774491267
 Health & BeautyFebruary 16, 2026Antidekubitní matrace Mat-X2
 TechnologyJanuary 19, 2026Industrial Bump Caps: Practical Head Protection for Low-Impact Work
 LogisticsApril 30, 2025Revolutionizing Pharmaceutical Shipping with Innovative Solutions